Weekly reporting cycle cut from 2 days of manual work to under 4 hours of review.
Live dashboards with real data within 14 days of project kickoff.
Daraz consolidated from three overlapping analytics tools to one governed layer.
The Challenge
Daraz, South Asia's leading e-commerce platform, was running its weekly operations review on manually built Excel reports. Three analysts spent two full days before each meeting pulling numbers from their OMS, warehouse systems, and marketing platforms.
Every report was slightly different. Marketing had their own revenue number. Ops had theirs. Finance had a third. Reconciling them before presenting to the exec team consumed half the value of the analytics function.
The team needed a single source of truth — fast enough to be useful, governed enough to be trusted.
“The Fabric Lakehouse eliminated three separate reporting tools we were paying for. My team's first question used to be 'which number is right?' Now the question is 'what do we do about it?'”
— James Park, Head of Data, Daraz
The Solution
IntelliFabric connected Daraz's order management system, warehouse platform, and marketing analytics into a unified Microsoft Fabric Lakehouse. The automated pipeline refreshed all core metrics every 4 hours.
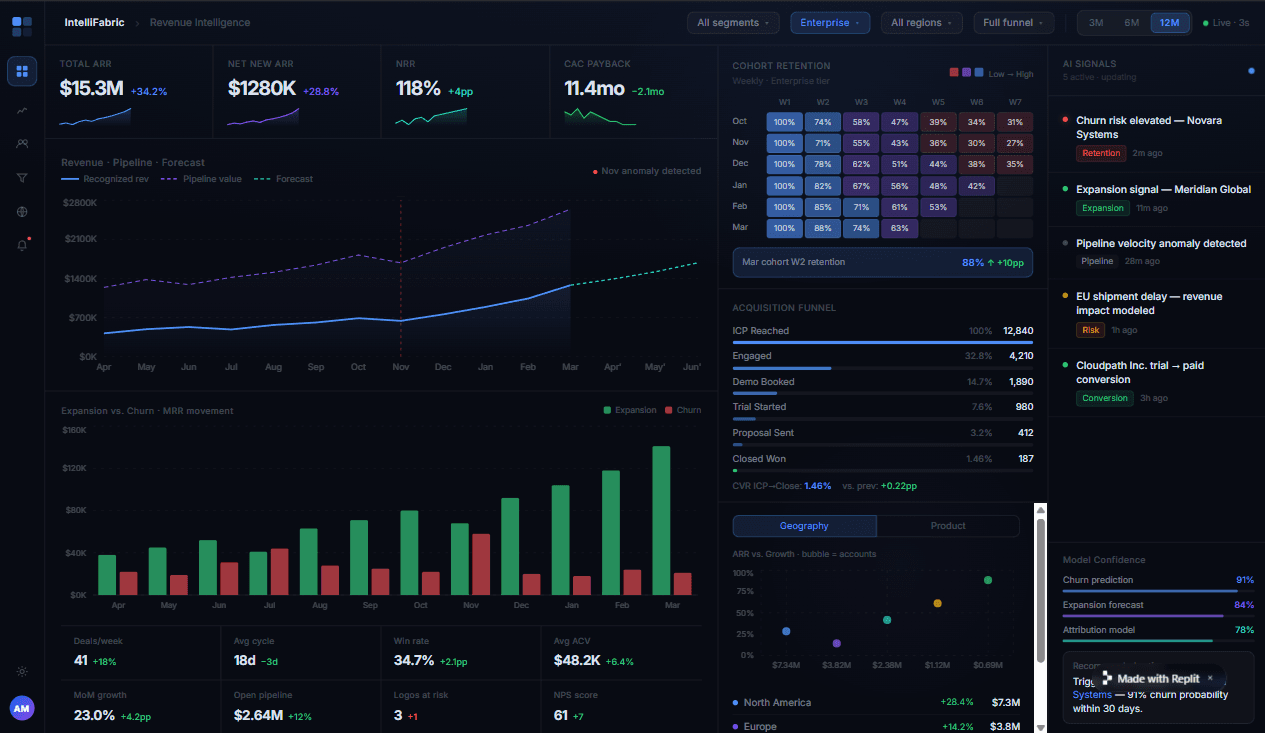
Pre-built e-commerce KPI dashboards — Revenue by Channel, Cart Abandonment Rate, Return Rate by SKU, and Customer Lifetime Value — were live within the first two weeks of implementation.
Role-gated Power BI reports gave the exec team, operations managers, and category buyers each their own view. No one sees a number they didn't ask for. Everyone trusts what they see.