IntelliFabric
← Solutions/Warehousing & Distribution
INDUSTRY SOLUTION

Operational clarity at the speed of the warehouse.

Your warehouse runs on speed. Your reporting doesn't. Picking accuracy numbers are reviewed at shift end. Dock-to-stock time lives in a WMS report nobody pulls. SLA risk is visible in hindsight, not in time to act.

IntelliFabric connects your WMS, TMS, and ERP to deliver shift-level dashboards your supervisors can actually act on — updated every 15 minutes, not every 15 days.

99.2%
Pick accuracy achieved
$0.80
Cost per order saved
4 wks
Typical go-live
app.intellifabric.com / warehousing
● LIVE
IntelliFabric Warehousing Operations Dashboard

What's breaking before IntelliFabric.

Every warehousing & distributionoperation we talk to faces the same six problems. If these sound familiar, you're not alone.
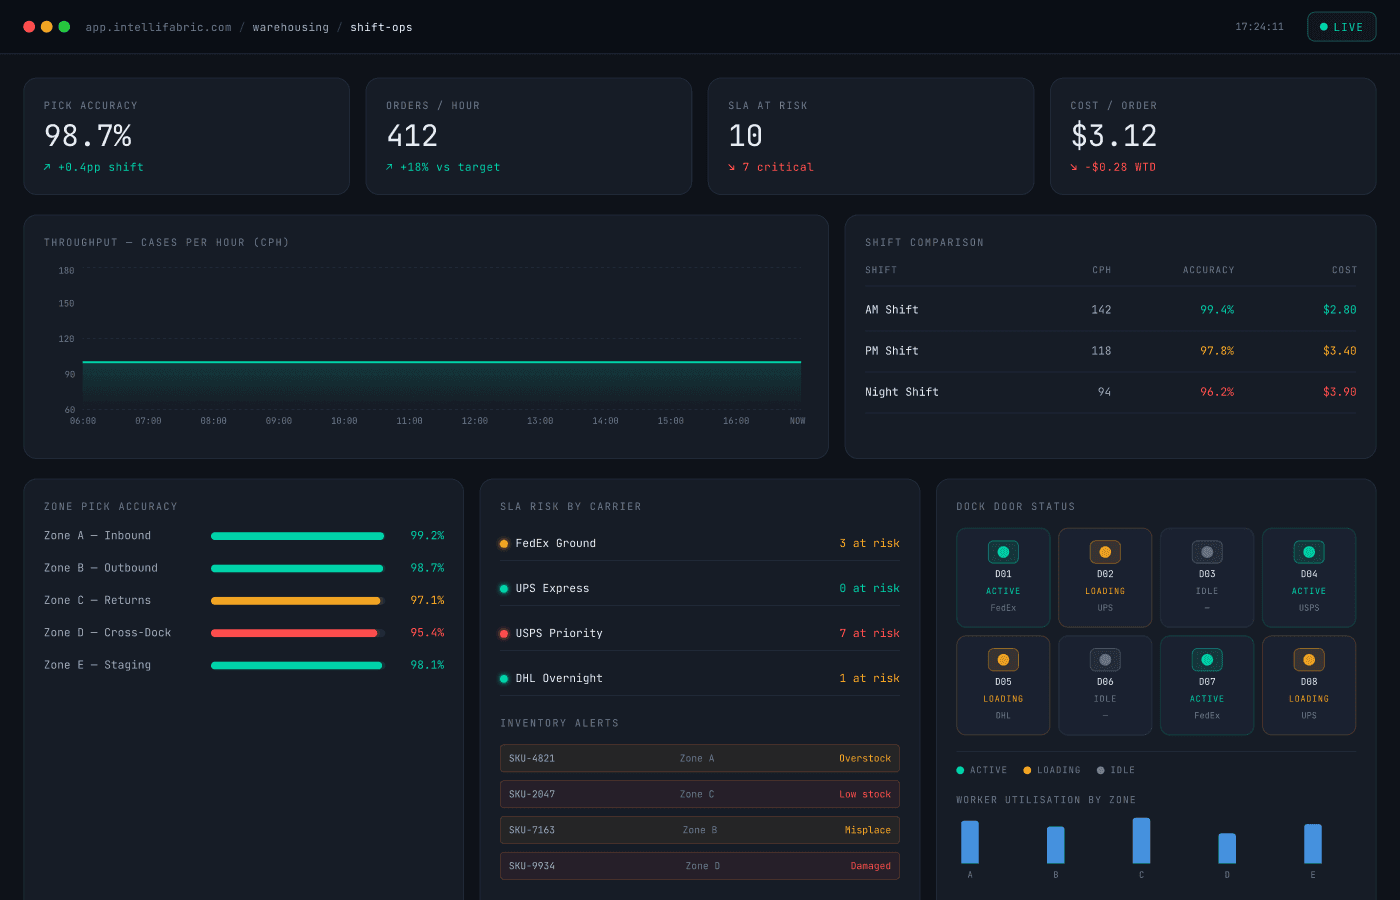
Pick errors are caught after the truck leaves

Picking accuracy is measured in post-dispatch audits. By the time a mis-pick is identified, the wrong order is already with the customer — and the return is underway.

Pick accuracy tracks by zone and shift in real time — error patterns surface before dispatch, not in the post-dispatch audit.

SLA risk is invisible until a customer calls

Orders at risk of missing the delivery window aren't flagged proactively. Supervisors only find out when the carrier misses the cut-off or operations gets an escalation.

Orders at risk of missing their SLA window are flagged automatically — with enough lead time to reroute or escalate before the carrier cut-off.

Labor cost is opaque across shifts

Productivity varies 30–40% between shifts but no one compares them in real time. The cost-per-order difference between best and worst shift isn't known until payroll closes.

Productivity and cost-per-order break down by shift and team, live — the gap between best and worst shift is visible while it can still be closed.

Dock utilization has no live view

Inbound and outbound dock scheduling is managed on whiteboards. When a carrier arrives early or late, the ripple effect on staffing and throughput isn't quantified.

Dock arrivals, staffing, and throughput are tracked together — carrier delay impact on downstream operations is quantified automatically, not estimated.

Inventory slotting decisions are based on gut feel

High-velocity SKUs aren't always in the optimal pick zone. Slotting reviews happen once a quarter because the data to support continuous optimization doesn't exist.

Pick velocity by zone is tracked continuously — slotting optimization signals surface from the data every day, not once a quarter.

Cost per order has no breakdown

You know the average cost per order. You don't know if it's driven by labor, carrier rates, dwell time, or damage. Fixing the wrong thing costs more than the problem.

Cost per order breaks down by labor, carrier, dwell, and damage — so you fix the right component, not just the biggest line item.

Every metric your team needs  pre-built.

These KPIs ship with IntelliFabric for Warehousing & Distribution. No custom build required — they arrive encoded with your data on day one.

Fulfillment
01
Pick Accuracy Rate
Correct picks as a percentage of total picks, by zone and shift
02
On-Time Delivery Rate
Orders delivered within committed window, by carrier and lane
03
Order Fill Rate
Orders shipped complete vs partial, by customer and SKU
04
Damage Rate
Units damaged in handling as a percentage of units processed
Labor & Cost
05
Cost per Order
Total fulfillment cost divided by orders shipped, by shift and channel
06
Labor Productivity per Shift
Lines per labor-hour and units per labor-hour by team
07
Orders Processed per Hour
Throughput rate by shift, zone, and order type
Inbound
08
Dock-to-Stock Time
Time from inbound receipt to put-away completion
09
Inbound Receipt Accuracy
Variance between PO quantity and received quantity
10
Returns Processing Time
Average time from returns receipt to restockable status
Capacity
11
Warehouse Space Utilization
Used vs available cubic capacity by zone and rack level
Carrier
12
Carrier On-Time Performance
Pickup and delivery compliance by carrier

Built for Warehousing & Distribution.
Not adapted from something else.

Generic BI tools can be configured for any industry. IntelliFabric ships with warehousing & distribution logic already encoded — data models, KPI definitions, and integration connectors specific to your operations.

Shift-level visibility — not daily averages

Every KPI updates every 15 minutes. Supervisors have the numbers to act before the shift ends — not after the debrief, when the cost is already locked in.

Cost per order broken down fully

Labor, carrier rates, dwell time, and damage are all modeled separately. You know which component is driving cost variance — and which lever to pull.

WMS, TMS, and ERP — one data model

We've built the connectors between Manhattan, Blue Yonder, FedEx APIs, and SAP before. One unified intelligence layer — no custom ETL to maintain between systems.

SLA risk surfaced before dispatch

Orders at risk of missing their delivery window are flagged automatically — with enough lead time to reroute, escalate, or adjust before the carrier cut-off.

Connects to every system you already run.

No rip-and-replace. IntelliFabric ingests from your existing stack using pre-built connectors and Microsoft Fabric data pipelines.

WMS
MN
Manhattan WMS
BY
Blue Yonder WMS
SAP Extended WM
ORC
Oracle WMS
TMS & Carriers
FedEx API
UPS API
SAP TM
ERP & Hardware
ORC
Oracle SCM
ZB
Zebra Mobile
HW
Honeywell Scanning

+ Any REST API, SFTP feed, or custom source — via Microsoft Fabric Data Factory connectors.

From kickoff to live in 4–6 weeks.

1
Week 1–2
Connect Systems
  • WMS connector and data extraction configured
  • TMS and carrier API feeds ingested
  • ERP inventory and order data connected
  • Shift and zone hierarchy defined
2
Week 3
Model Operations
  • Pick accuracy and error rate logic built
  • Cost-per-order calculation encoded
  • Labor productivity model configured
  • SLA and delivery window rules set
3
Week 4–5
Deploy Dashboards
  • Shift operations dashboard live
  • Zone performance and pick accuracy active
  • Labor productivity vs cost reporting deployed
  • On-time delivery and SLA risk flags configured
4
Week 6
Activate & Train
  • Shift supervisor training on live dashboards
  • Operations manager reporting walkthrough
  • Executive KPI dashboard sign-off
  • Managed service handover

What clients actually achieve.

0.2%

Pick accuracy achieved

Shift-level dashboards catch error patterns before dispatch — not after

$0.80
Cost per order reduction

Labor and routing optimization from real-time productivity visibility

0 wks

Time to go live

WMS + TMS + ERP unified and live in a single operations dashboard

See IntelliFabric for Warehousing & Distribution.

Book a 30-minute demo and we'll walk you through exactly how IntelliFabric would work with your data and systems.